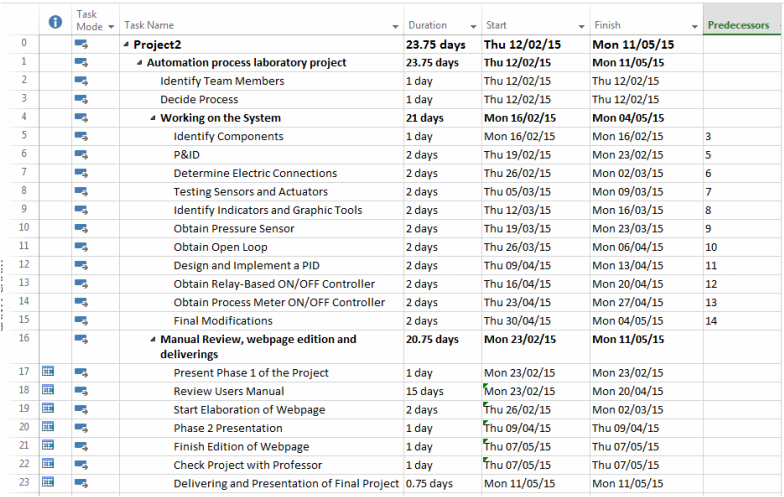
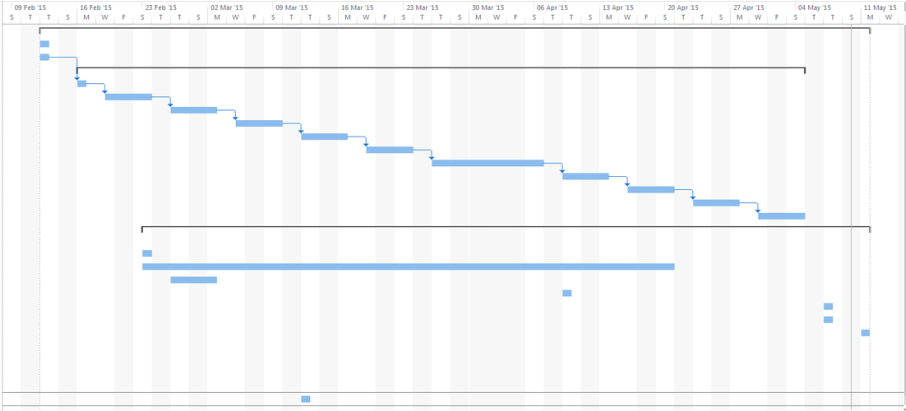
The Gannt chart illustrates the project schedule. It describes the workdays as the start and finish dates of each activity. All activities were realized by every team member, the members got together in class every mondays and thursdays since April to work at the system. The project was planned to be finished in three months, since February 12th to May 11th (Delivering date) and the objective was accomplished as seen in the Gantt Chart. It was realized in Microsoft Project 2013.
